What a 5% Ten-Year Does to a 5.75% Cap Rate
Summary. The Fed raised the funds rate 25 bps to 3.75–4.00% on September 16, the first increase since 2023, on a 12–0 vote. The dot plot now has year-end 2026 at 4.1–4.4%, up from 3.6–4.1% in June, and markets price another hike this year. The 10-year, which was 3.97% on February 27, closed at 5.18% on September 24 — a 121 bp move in seven months.
Apartment transaction cap rates, meanwhile, have sat between 5.55% and 5.75% for nine quarters. RealPage put Q4 2025 at 5.55% and Freddie Mac reports a 20 bp increase in Q1 2026, to roughly 5.75%. Stabilized agency debt at benchmark plus 110–200 bps now prices at 6.3–7.2%.
That combination — coupon above cap rate — is negative leverage, and it has not been this wide since the 2023 peak. Three consequences follow, all of which we quantify below:
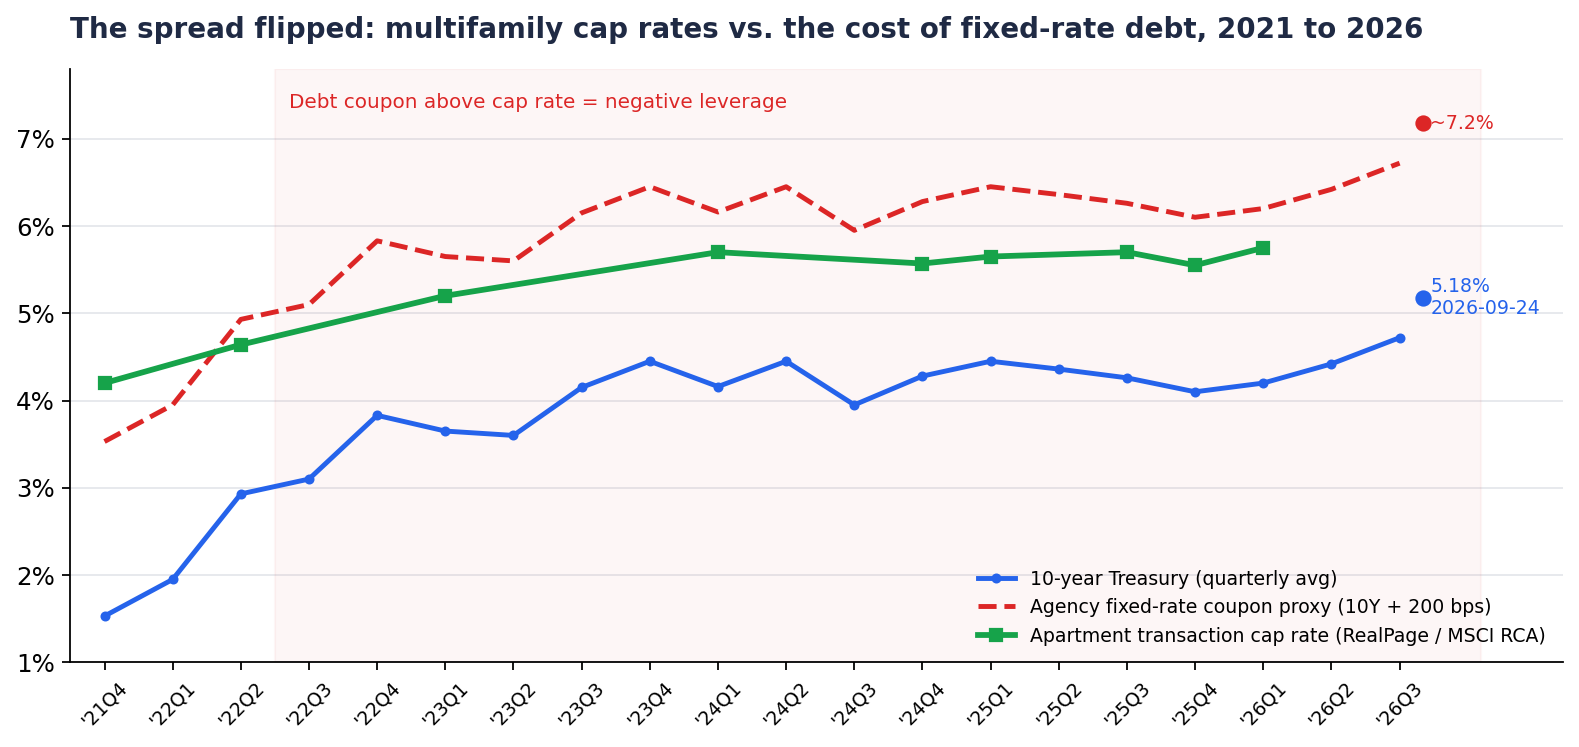
The index. The 10-year averaged 4.20% in Q1 2026, 4.42% in Q2, and 4.72% so far in Q3 (FRED DGS10). The daily low for the year was 3.97% on February 27. It touched 5.014% intraday on September 14, closed at 5.01% on the day of the Fed decision, and reached 5.18% on September 24. Chairman Warsh attributed the long-end move to economic strength, competition for capital and geopolitics — oil above $100 on the Iran conflict — rather than to Fed policy, which is another way of saying the Fed doesn't expect to bring it down.
The spread. Stabilized agency executions on conventional 5- and 10-year fixed grids have been quoting around benchmark plus 110–170 bps in August–September quote cycles, with the older rule of thumb at 200–250 bps still applying to smaller loans, weaker tiers and lower debt yields. We use 200 bps in the model; at 150 the coupon is 6.7% instead of 7.2% and every conclusion below holds with slightly smaller numbers. The residential comparison is instructive: the 30-year mortgage spread over the 10-year sat at 1.96 points in both late February and mid-September, so the entire 97 bp rise in mortgage rates passed straight through from the bond market. Freddie Mac's 30-year hit 7.03% on September 24.
Cap rates. RealPage, citing MSCI RCA: 5.57% average for 2024, 5.65% in Q1 2025, 5.55% in Q4 2025. MSCI's own series has apartments flat at 5.6–5.7% for eight consecutive quarters. Freddie Mac's Q1 2026 investor deck reports cap rates up 20 bps in the quarter, with the cap-rate-to-Treasury spread at ~155 bps, "just above half its historic average since 2000." That spread is now closer to 60 bps on the September 10-year.
The chart above puts the three series together. The cap-rate line crossed below the coupon line in mid-2022 and has stayed there. What changed this month is the gap: at 5.75% versus 7.2%, it is roughly 145 bps, versus about 20 bps in February.
We use the same representative acquisition as our earlier notes: $24M purchase price (the 2025 average deal size), now at a 5.75% going-in cap to reflect Q1 2026 pricing, 3% NOI growth, 30-year amortization, 5-year hold, 6.00% exit cap, 2% selling costs. Debt is priced at the 10-year plus 200 bps: 5.97% in late February, 7.18% today.
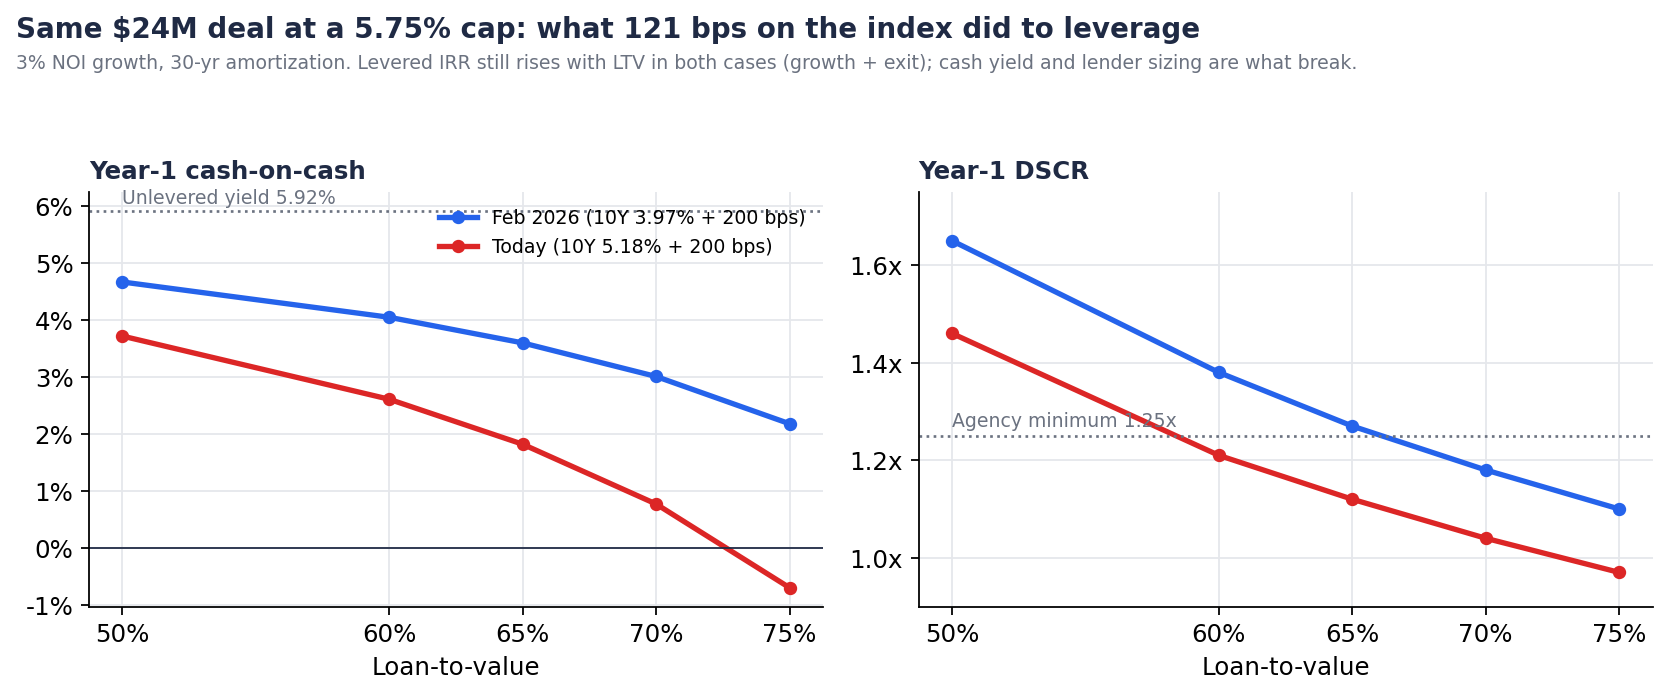
Cash yield. Unlevered, the deal yields 5.92% in year one. In February, borrowing at 5.97% was roughly neutral — each dollar of debt cost about what it earned, and cash-on-cash drifted from 4.7% at 50% LTV to 2.2% at 75%. Today, borrowing at 7.18% costs 126 bps more than the asset earns. Cash-on-cash is 3.7% at 50% LTV, 1.8% at 65%, and −0.7% at 75%. At the leverage most syndicators underwrite to, the property does not cover its own debt service and a distribution.
Lender sizing. Agencies size to a 1.25x minimum DSCR on the forward year. On this deal that constraint allowed about 66% LTV in February. At today's coupon it allows about 58%. The sponsor who planned on $15.9M of proceeds gets $14.0M, and needs $10.0M of equity instead of $8.1M for the same building. For a syndicator whose raise was sized in the spring, that is a 23% larger equity check or a smaller deal.
Levered IRR. This is where the models mislead. With 3% growth and an exit at 6.00%, five-year levered IRR still rises with LTV at both coupons: 8.3% unlevered, 12.0% at 65% LTV in February, 10.2% at 65% LTV today. Leverage appears accretive because the exit is doing the work — amortization and NOI growth over five years are enough to overcome a negative year-one spread. A model that reports IRR alone will show a deal that "works" at 70% LTV and 0.8% cash-on-cash. It works only if rents grow as modeled, the exit cap is 6.00% or better in 2031, and the LPs are content to receive almost nothing for five years.
| At 65% LTV | February 2026 | Today | Change |
|---|---|---|---|
| Debt coupon | 5.97% | 7.18% | +121 bps |
| Year-1 cash-on-cash | 3.6% | 1.8% | −180 bps |
| Year-1 DSCR | 1.27x | 1.12x | Below agency floor |
| Max LTV at 1.25x | 66% | 58% | −8 points |
| 5-year levered IRR | 12.0% | 10.2% | −184 bps |
None of this is new to anyone who transacted in 2023, when the same spread opened up and volume fell to $120B. The difference is that the 2023 episode was expected to be temporary, and the response was to wait. Cap rates were supposed to reprice, or rates were supposed to come down. Neither happened enough; the 10-year spent 2024 and 2025 between 3.6% and 4.8%, cap rates settled at 5.6%, and volume recovered to $165B in 2025 on the assumption that the range would hold. September broke the range on the wrong side, and the Fed's own projections now describe a "much slower, more cautious descent" from here.
The structural responses are the same ones that worked in 2023, and their costs are more visible now:
Lower leverage. The obvious one. 50–55% LTV keeps DSCR above 1.4x and cash-on-cash near 3.5%. It also means a $24M deal needs $11–12M of equity, and the syndicator's promote is calculated on a smaller spread.
Assumable debt. A 2021-vintage agency loan at 3.5–4.0% is worth real money to a buyer. The gap between an assumable 3.75% coupon and a 7.18% new loan on $14M of proceeds is about $480K a year in debt service. Sellers with assumable loans are pricing that in; buyers who can find and close them have an edge that has nothing to do with operating skill.
Seller financing and structure. Seller carry-backs, preferred equity from the seller, and earn-out pricing all move part of the negative-leverage cost onto the seller in exchange for a closing. These structures are slower to negotiate and harder to underwrite.
Rate buydowns and caps. Buying the coupon down 50–75 bps costs 2–4 points up front. Floating-rate bridge at SOFR plus 275–500 bps is more expensive, not less, and cap costs have risen with volatility.
Underwriting to cap-rate expansion that hasn't happened. The most common response, and the least honest. If transaction cap rates move to 6.25–6.50% to restore a spread over debt, prices fall 8–12% and today's buyer at 5.75% has bought at the top. Sellers know this and are not moving; RealPage reported Q1 2026 volume down sharply on exactly this standoff. A buyer who assumes a 6.5% cap on the way in is describing a market that doesn't exist yet.
Three things follow from the numbers.
Cash-on-cash and DSCR need to sit next to IRR in every model, and the lender's DSCR test needs to size the loan. A model that lets the user type in 70% LTV at a 7.2% coupon on a 5.75% cap is producing a loan that will not be offered. Proceeds should be an output of the DSCR constraint, not an input.
The leverage assumption is now the most volatile input, not the exit cap. In our earlier note on assumption staleness, the 10-year's move from 3.97% to 4.95% was worth 150 bps of levered IRR. It has since moved another 23 bps, and the Fed has signaled it does not intend to reverse it. A deal underwritten in the spring at spring proceeds is a different deal now, and the difference shows up first in the equity check.
The premium is on structure, not on picking the right building. Between two sponsors looking at the same asset at the same price, the one who finds the assumable loan, negotiates seller carry, or restructures to 55% LTV with preferred equity gets a deal that cash-flows. The one running a single capital structure through a single model gets a deal that pencils on IRR and fails on distributions. Finding the structure that works means re-running the deal several times, quickly, with the debt sized properly each time.
Teez sizes debt from the DSCR constraint and re-runs the model at each structure — LTV, coupon, IO period, seller carry, pref — in minutes rather than hours, so the capital stack that actually works is found before the LOI, not after. More at teez.ai.