What a Flat Opex Assumption Missed, 2021 to 2026
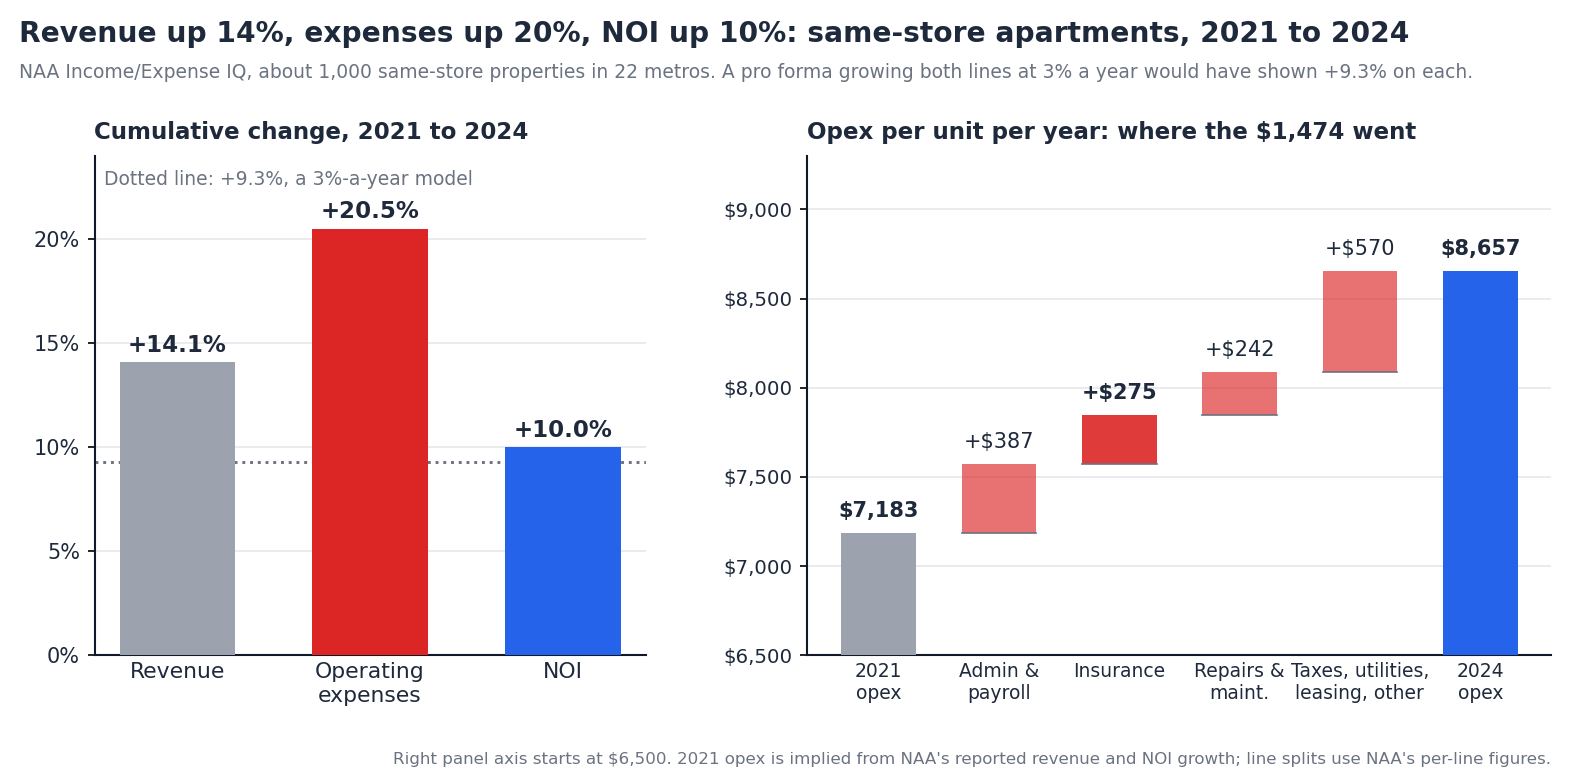
Summary. Four notes in this series have been about the cost of debt. This one is about the line above it. The National Apartment Association's same-store survey, about 1,000 properties in 22 metros tracked from 2021 to 2024, shows revenue per unit up 14.1%, operating expenses up about 20%, and NOI up 10%. A pro forma written in 2021 that grew both lines at 3% a year would have shown each up 9.3%.
The NOI number looks fine. It is not. NOI matched the model only because revenue grew half again as fast as the model assumed, and the expense line took the difference. We run the representative $24M building through what happened, then through what happens next at today's rent growth. Findings:
The survey. The National Apartment Association's 2024 Income/Expense IQ, published with IREM and BOMA, covers 4,666 conventional properties and 1.09 million units across 109 metros. Its same-store cut tracks about 1,000 properties in 22 metros with consistent data from 2021 through 2024. We use the same-store figures throughout.
The lines. Total income per unit was $21,017 in 2024, up 1.5% on the year and 14.1% since 2021. Operating expenses were $8,657 per unit, up 2.2% on the year. NOI grew about 10% over the three years, and NAA describes 2024 NOI growth as "narrowly" positive. The survey does not print 2021 expenses, but the revenue and NOI growth it does print imply them: about $7,180 per unit, so expenses rose about 20.5%.
| Per unit, same store | 2021 (implied) | 2024 | Change | Per year |
|---|---|---|---|---|
| Total income | $18,420 | $21,017 | +14.1% | +4.5% |
| Operating expenses | $7,180 | $8,657 | +20.5% | +6.4% |
| NOI | $11,240 | $12,360 | +10.0% | +3.2% |
| Expense ratio | 39.0% | 41.2% | +2.2 pts |
What a 2021 model assumed. The convention is to grow revenue at 2% to 3% and expenses at 2% to 3%, often the same number for both. CBRE's underwriting survey put three-year rent growth at 2.8% for core and 3.3% for value-add in mid-2025, and nothing in the survey suggests expense assumptions above that. At 3% on both lines, each would be up 9.3% by 2024 and NOI with them.
What happened instead. NOI came in at +10%, which is the number a reviewer would check and pass. It arrived by a different route: revenue grew half again as fast as modeled and expenses grew more than twice as fast. The margin gave up 220 basis points. A model that got NOI right for the wrong reasons has no information about what happens when the revenue tailwind stops, which, as of the third quarter of 2026, it has.
Of the $1,474 per unit added to the expense line between 2021 and 2024:
Administrative and payroll, about $390, 26%. The largest piece, at $2,323 per unit in 2024, up 3.8% on the year and nearly 20% since 2021. Payroll alone rose 3.6% in 2024. This is the line owners control least once a property is staffed.
Insurance, $275, 19%. From $502 per unit in 2021 to $777 in 2024, a 55% rise: 11% in 2022, 25% in 2023, 12% in 2024. Its share of operating expenses went from 7% to 9%. The Federal Reserve's study of 24,000 to 28,000 CMBS-financed properties a year puts the real increase at more than 75% between 2019 and 2024, to about 5% of revenue, and finds that a 10% increase in insurance cost is associated with a 0.25% fall in NOI. Each extra dollar of premium reduces net income by about 74 cents; landlords recover the rest through renewals, not asking rents. The increases were largest in Florida, the Gulf coasts and the Southeast.
Repairs and maintenance, $242, 16%. $1,098 per unit in 2024, up 3.7% on the year and 28.2% since 2021. Turnover costs rose 17.5% in 2024 alone.
Everything else, about $570, 39%. Property taxes, utilities, leasing, management fees and contract services. NAA reports taxes and insurance together at $2,998 per unit, up 2.65% in 2024, with taxes "slightly moderated" after a 9.7% rise in 2023. Utilities fell 3.2% in 2024 after rising earlier. Leasing was $292 per unit, up 4.6%.
Yardi Matrix's larger sample, 20,000 properties on its software, tells the same story a year earlier: expenses per unit up 7.1% in the year to January 2024, with insurance up 27.7%, marketing 12.3%, administrative 9.6% and repairs 8.8%. Of 129 markets, 99 saw expense growth of 5% or more.
The pattern matters for the model. Two of the three largest lines, insurance and payroll, are set by markets the owner does not participate in. A single expense growth rate hides that the controllable lines grew at about the modeled rate and the uncontrollable ones at two to four times it.
The building is the one from the earlier notes: bought for $24M in Q4 2021 at a 4.7% cap, so $1.128M of NOI. At the NAA 2021 margin that is $1.85M of revenue and $0.72M of expenses. We grow it three ways to 2024.
| 2021 to 2024 | Revenue growth | Expense growth | 2024 NOI | vs model |
|---|---|---|---|---|
| The 2021 pro forma | 3.0% a year | 3.0% a year | $1.233M | |
| What happened (NAA) | 4.5% | 6.4% | $1.241M | +$8K |
| Actual revenue, modeled expenses | 4.5% | 3.0% | $1.322M | +$89K |
The model was right by accident. Actual NOI landed $8K above the pro forma. The owner who checked the NOI line against the 2021 model in 2024 saw a deal on plan. Underneath, revenue beat the model by $100K a year and expenses beat it by $92K the other way.
The expense line cost $81K a year. With actual revenue and the modeled 3% expense growth, NOI would be $1.322M. The $81K difference is $1.35M of value at a 6% exit cap, about 6% of the $21.6M the building is worth today. On the $18M bridge loan from the refinance gap note, it is the difference between a $5.9M shortfall and a $4.7M one.
The margin is the number to watch. The building's expense ratio went from 39% to 41%. At a fixed cap rate, every point of margin on $2.1M of revenue is $21K of NOI and $350K of value. A model that grows both lines at one rate holds the margin constant by construction and cannot see this.
The revenue tailwind that covered the expense line has stopped. RealPage puts same-store effective rent growth at 0.9% year over year in the third quarter of 2026, the first positive reading since mid-2025, with occupancy at 95.4% and 318,000 units delivered in the trailing year. Its forecast for the coming year is 2.4%. Cushman & Wakefield's asking-rent series is higher at 2.3%, with the Northeast at 3.7% and the South at 1.1%.
Whether the expense line has slowed is less clear. NAA's 2024 figures show total expenses up 2.2%, with insurance still up 10.8%. Trepp reports median insurance growth cooling to 2.7% in the past year from 10.9%. Essex guided 3% expense growth for 2026. The 2021 to 2024 rate of 6.4% is the pessimistic case; 3% is the optimistic one and also the number most models still carry.
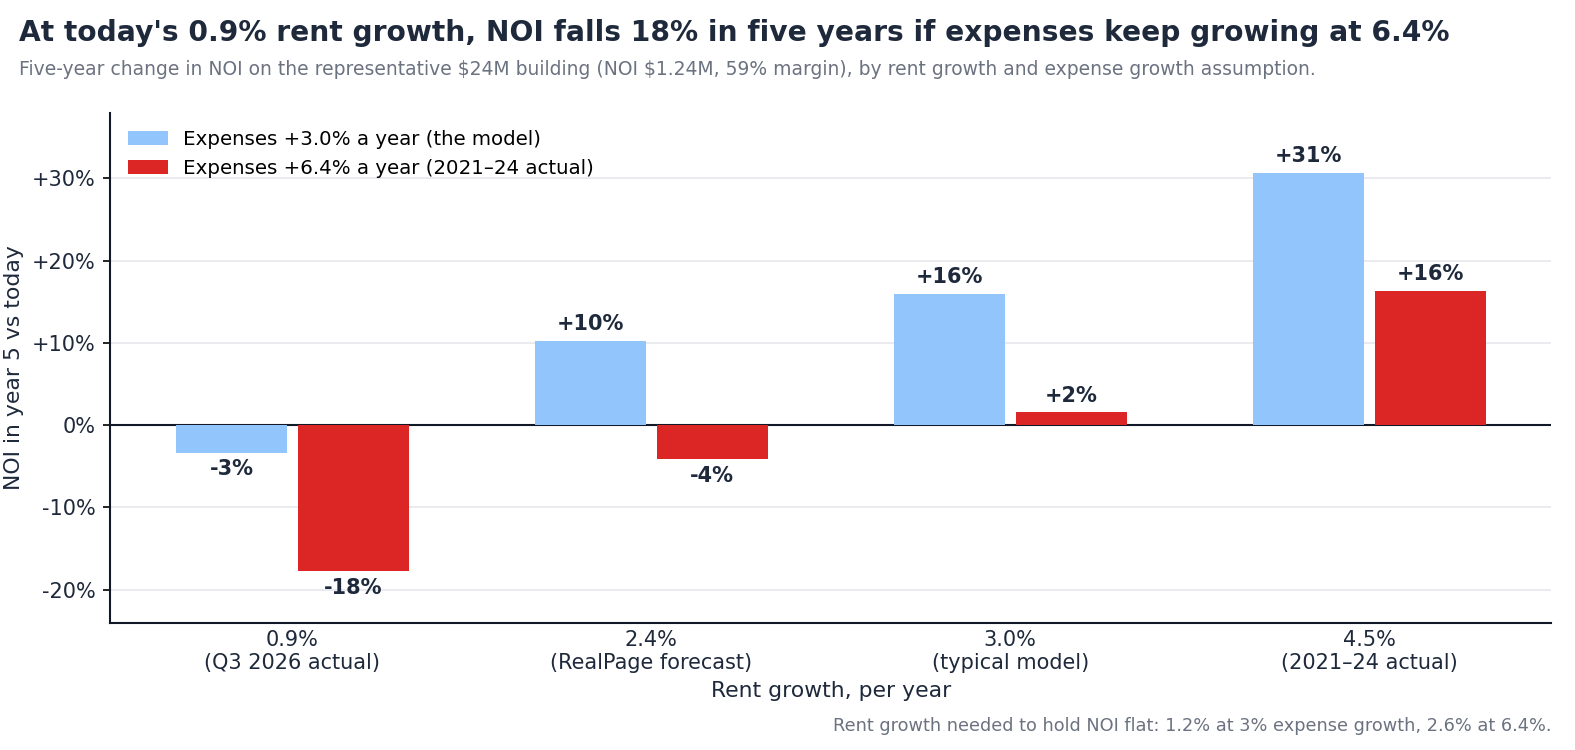
At today's rent growth, NOI falls either way. At 0.9% rent growth and 3% expense growth, NOI is down 3% in five years. At 6.4% expense growth it is down 18%, and the building is worth $17M at exit instead of $20M.
The break-even. Holding NOI flat needs 1.2% rent growth if expenses grow 3%, and 2.6% if they grow 6.4%. RealPage's 2.4% forecast clears the first and not the second. A model carrying 3% rent growth and 3% expense growth shows NOI up 16% over five years; the same rent growth with the observed expense growth shows 2%.
The 2021 to 2024 revenue growth does not come back on the forecast. At 4.5% rent growth the building absorbs 6.4% expense growth and still grows NOI 16%. That is the combination the industry just lived through and the reason the problem has been invisible. It required rent growth that no forecaster is projecting.
Three things follow.
Grow the expense lines separately. Insurance, taxes and payroll are set by markets the owner does not participate in, and they grew at two to four times the modeled rate. Repairs, marketing and contract services are controllable and grew at roughly the modeled rate. One expense growth rate averages them into a number that was wrong in both directions. The T-12 already has the lines; the model should keep them.
Underwrite the margin, not the NOI. The 2024 NOI matched the 2021 pro forma and the deal was worse than modeled. Revenue growth, expense growth and the expense ratio are three numbers; NOI is one. A review that checks the one will pass a deal the three would have flagged.
The break-even rent growth belongs on the summary page. For this building it is 1.2% to 2.6% a year depending on the expense assumption, and the market is delivering 0.9%. A sponsor who knows that number before bidding knows how much of the business plan rests on rent growth that is not currently happening.
The model is simple: one revenue line, one expense line, growth applied uniformly, and the NAA same-store rates treated as national. Regional variation is large, and a coastal Florida property's insurance line alone can exceed the national total expense growth. Each of those moves a specific deal's number. None changes the finding that NOI growth since 2021 was borrowed from a revenue tailwind that has ended.
Teez reads the T-12 line by line, carries each expense at its own growth rate, and puts the expense ratio and the break-even rent growth on the first page of the model, so a deal that is on plan at the NOI line and off plan underneath shows up before the LOI. More at teez.ai.